Collectors Rare Coin Index
The Collectors Rare Coin Index (or CRCI for short) charts the averaged price change percentages on a monthly basis of 100 of the rarest and most popular United States coins. Many collectors would call them key dates.
The purpose of the Index is to assess the overall direction and strength of the market for "blue chip" coins over a period beginning in January 1990 to the current month, with a starting baseline of 100.00%.
Hover over the chart to review the data in greater detail.
In January 2026, the Collectors Rare Coin Index sits at 782.47%. This is an all-time record high for the Index.
This index charts the averaged percent performances of 100 key date United States coins. It does not track the cumulative retail dollar values of all 100 coins. For those interested in that data: The value of all 100 coins in January 1990 totaled $581,427. By January 2026, those same coins were cumulatively priced at $4,918,860. This is about 846% of the starting value. Not bad!
For collectors wanting to study cumulative pricing trends of the 100 CRCI coins in greater detail, we have a live, interactive chart for your convenience.
Meet the 100 Index Coins
The 100 coins selected for the CRCI are essentially a subset taken from the Key Date List of recommendations. The GOOD, BETTER, BEST, and Classic Rarities categories are all well represented in the monthly tracking.
Every one of the 100 coins tracked in the Collectors Rare Coin Index has a chart of its own, enabling you to evaluate percentage performances for individual coins compared to the overall Index movements.
Let's meet the 100 Index coins:
1793 Liberty Cap, Facing Left Half Cent
1796 Liberty Cap, Facing Right Half Cent, No Pole
1793 Flowing Hair Cent, Chain Rev, AMERI.
1793 Liberty Cap Cent
1794 Liberty Cap Cent, Starred Reverse
1804 Draped Bust Cent
1856 Flying Eagle Cent
1877 Indian Head Cent
1909-S VDB Lincoln Cent
1914-D Lincoln Cent
1922-D Lincoln Cent, Missing D
1955 Lincoln Cent, Double Die
1864 Shield Two Cent, Small Motto
1884 Three Cent CN
1792 Half Disme
1802 Draped Bust Large Eagle Half Dime
1846 Seated Liberty Half Dime
1880 Shield Nickel
1883 3/2 Shield Nickel
1885 Liberty Nickel
1913-S Buffalo Nickel, Type 2
1937-D Buffalo Nickel, 3 Legs
1804 Draped Bust Large Eagle Dime, 13 Star Rev
1822 Capped Bust Dime
1843-O Seated Liberty Dime
1871-CC Seated Liberty Dime
1872-CC Seated Liberty Dime
1895-O Barber Dime
1916-D Mercury Dime
1875-CC Seated Liberty Twenty-Cent
1796 Draped Bust Quarter, Small Eagle
1804 Draped Bust Large Eagle Quarter
1822 Capped Bust Quarter, 25/50 C
1823 Capped Bust Quarter, 3/2
1828 Capped Bust Quarter, 25/50 C
1856-S Seated Liberty Quarter
1870-CC Seated Liberty Quarter
1871-CC Seated Liberty Quarter
1872-CC Seated Liberty Quarter
1872-S Seated Liberty Quarter
1896-S Barber Quarter
1901-S Barber Quarter
1913-S Barber Quarter
1916 Standing Liberty Quarter
1932-D Washington Quarter
1794 Flowing Hair Half Dollar
1796 Drap Bust Sm Eagle Half Dollar, 15 Stars
1872-CC Seated Liberty Half Dollar
1921-D Walking Liberty Half Dollar
1794 Flowing Hair Dollar
|
1802 Drap Bust Lg Eagle Dollar, 2/1, Wide Dt
1873-CC Trade Dollar
1878-CC Morgan Dollar
1893-CC Morgan Dollar
1893-S Morgan Dollar
1894 Morgan Dollar
1895 Morgan Dollar
1895-S Morgan Dollar
1921 Peace Dollar
1861-D Gold Dollar, Type 3
1796 Capped Bust $2.50 Quarter Eagle, Stars
1808 Capped Draped Bust $2.50 Quarter Eagle
1848 Coronet $2.50 Quarter Eagle, CAL.
1854-S Coronet $2.50 Quarter Eagle
1854-D Indian Head Three Dollar
1795 Capped Bust Small Eagle $5 Half Eagle
1810 Cap Drap Bust $5 Half Eagle, Lg Dt & Sm 5
1821 Capped Head $5 Half Eagle
1830 Capped Head $5 Half Eagle, Large 5D
1831 Capped Head $5 Half Eagle, Large 5D
1833 Capped Head $5 Half Eagle, Large Date
1834 Capped Head $5 Half Eagle, Cross 4
1861-D Coronet $5 Half Eagle
1864-S Coronet $5 Half Eagle
1870-CC Coronet $5 Half Eagle
1909-O Indian Head $5 Half Eagle
1929 Indian Head $5 Half Eagle
1795 Cap Bust Sm Eagle $10 Eagle, 13 Leaves
1797 Capped Bust Large Eagle $10 Eagle
1838 Coronet $10 Eagle
1841-O Coronet $10 Eagle
1870-CC Coronet $10 Eagle
1873-CC Coronet $10 Eagle
1883-O Coronet $10 Eagle
1907 Indian Head $10 Eagle, Wire Rim, Periods
1920-S Indian Head $10 Eagle
1854-O Coronet $20 Double Eagle
1856-O Coronet $20 Double Eagle
1860-O Coronet $20 Double Eagle
1861-S Coronet $20 Double Eagle, Paquet Rev
1863 Coronet $20 Double Eagle
1864 Coronet $20 Double Eagle
1870-CC Coronet $20 Double Eagle
1878-CC Coronet $20 Double Eagle
1879-O Coronet $20 Double Eagle
1881 Coronet $20 Double Eagle
1889-CC Coronet $20 Double Eagle
1891 Coronet $20 Double Eagle
1921 Saint-Gaudens $20 Double Eagle
1926-D Saint-Gaudens $20 Double Eagle
|
1793 Liberty Cap, Facing Left Half Cent
1796 Liberty Cap, Facing Right Half Cent, No Pole
1793 Flowing Hair Cent, Chain Rev, AMERI.
1793 Liberty Cap Cent
1794 Liberty Cap Cent, Starred Reverse
1804 Draped Bust Cent
1856 Flying Eagle Cent
1877 Indian Head Cent
1909-S VDB Lincoln Cent
1914-D Lincoln Cent
1922-D Lincoln Cent, Missing D
1955 Lincoln Cent, Double Die
1864 Shield Two Cent, Small Motto
1884 Three Cent CN
1792 Half Disme
1802 Draped Bust Large Eagle Half Dime
1846 Seated Liberty Half Dime
1880 Shield Nickel
1883 3/2 Shield Nickel
1885 Liberty Nickel
1913-S Buffalo Nickel, Type 2
1937-D Buffalo Nickel, 3 Legs
1804 Draped Bust Large Eagle Dime, 13 Star Rev
1822 Capped Bust Dime
1843-O Seated Liberty Dime
1871-CC Seated Liberty Dime
1872-CC Seated Liberty Dime
1895-O Barber Dime
1916-D Mercury Dime
1875-CC Seated Liberty Twenty-Cent
1796 Draped Bust Quarter, Small Eagle
1804 Draped Bust Large Eagle Quarter
1822 Capped Bust Quarter, 25/50 C
1823 Capped Bust Quarter, 3/2
1828 Capped Bust Quarter, 25/50 C
1856-S Seated Liberty Quarter
1870-CC Seated Liberty Quarter
1871-CC Seated Liberty Quarter
1872-CC Seated Liberty Quarter
1872-S Seated Liberty Quarter
1896-S Barber Quarter
1901-S Barber Quarter
1913-S Barber Quarter
1916 Standing Liberty Quarter
1932-D Washington Quarter
1794 Flowing Hair Half Dollar
1796 Drap Bust Sm Eagle Half Dollar, 15 Stars
1872-CC Seated Liberty Half Dollar
1921-D Walking Liberty Half Dollar
1794 Flowing Hair Dollar
1802 Drap Bust Lg Eagle Dollar, 2/1, Wide Dt
1873-CC Trade Dollar
1878-CC Morgan Dollar
1893-CC Morgan Dollar
1893-S Morgan Dollar
1894 Morgan Dollar
1895 Morgan Dollar
1895-S Morgan Dollar
1921 Peace Dollar
1861-D Gold Dollar, Type 3
1796 Capped Bust $2.50 Quarter Eagle, Stars
1808 Capped Draped Bust $2.50 Quarter Eagle
1848 Coronet $2.50 Quarter Eagle, CAL.
1854-S Coronet $2.50 Quarter Eagle
1854-D Indian Head Three Dollar
1795 Capped Bust Small Eagle $5 Half Eagle
1810 Cap Drap Bust $5 Half Eagle, Lg Dt & Sm 5
1821 Capped Head $5 Half Eagle
1830 Capped Head $5 Half Eagle, Large 5D
1831 Capped Head $5 Half Eagle, Large 5D
1833 Capped Head $5 Half Eagle, Large Date
1834 Capped Head $5 Half Eagle, Cross 4
1861-D Coronet $5 Half Eagle
1864-S Coronet $5 Half Eagle
1870-CC Coronet $5 Half Eagle
1909-O Indian Head $5 Half Eagle
1929 Indian Head $5 Half Eagle
1795 Cap Bust Sm Eagle $10 Eagle, 13 Leaves
1797 Capped Bust Large Eagle $10 Eagle
1838 Coronet $10 Eagle
1841-O Coronet $10 Eagle
1870-CC Coronet $10 Eagle
1873-CC Coronet $10 Eagle
1883-O Coronet $10 Eagle
1907 Indian Head $10 Eagle, Wire Rim, Periods
1920-S Indian Head $10 Eagle
1854-O Coronet $20 Double Eagle
1856-O Coronet $20 Double Eagle
1860-O Coronet $20 Double Eagle
1861-S Coronet $20 Double Eagle, Paquet Rev
1863 Coronet $20 Double Eagle
1864 Coronet $20 Double Eagle
1870-CC Coronet $20 Double Eagle
1878-CC Coronet $20 Double Eagle
1879-O Coronet $20 Double Eagle
1881 Coronet $20 Double Eagle
1889-CC Coronet $20 Double Eagle
1891 Coronet $20 Double Eagle
1921 Saint-Gaudens $20 Double Eagle
1926-D Saint-Gaudens $20 Double Eagle
|
As most experienced collectors would agree, these are some of the most outstanding coins in United States numismatics.
And now, a few more details on the Collectors Rare Coin Index, including some backdrop information. Optional reading, thank goodness!
No advanced math skills necessary to continue...
What Exactly Does an Index Do?
As you may know, an index, in this sense, is designed to be a “barometer” for a given market. It is expressed as a number calculated from a series of periodical observations and measured against a baseline, or starting point of the Index. The main idea of an index is to get a feel for how well a particular market is performing currently and over time. Are values trending up, down or sideways?
Indexes (the word “indices” is often used as the plural form) are highly visible in our everyday lives. A couple of well-known indexes are the Dow Jones Industrial Average and the Consumer Price Index.

Indexes are a big part of our everyday lives. One of the best known is the Dow Jones Industrial Average (DJIA), created in 1896 by Charles Dow and Edward Jones. The DJIA Index tracks the stock prices of 30 large, publicly-owned companies in an effort the gauge the stock market’s overall direction. Other widely followed stock market indexes include the S&P 500 and Nasdaq Composite. The Consumer Price Index (CPI) also has a high profile as it attempts to quantify the U.S. inflation rate. Image by
Shutterstock.
How to Benefit from the Collectors Rare Coin Index
As the opening paragraph stated, the Collectors Rare Coin Index charts the averaged percent performances of 100 coins chosen to represent the "cream of the crop" slice of the United States coin market.
Only U.S. Mint types issued for circulation were considered for inclusion in the Index. By charting percentage movements, all coins are weighted equally (had we charted estimated dollar values, the more expensive coins would have had greater potential to sway the Index).
The CRCI was designed as an informational tool to benefit collectors who pursue United States coins perceived to be rare and historically favored. These connoisseurs occupy a significant swath of the numismatist population (where many of us dwell) and who desire to understand the retailing vigor, past and present, for the small universe of coins we crave most to own.

The
Collector Rare Coin Index tracks the performance of 100 U.S. coins traditionally admired as rarities and craved by collectors for generations. Warning: don’t stand in the path between a motivated numismatist and an 1848 CAL. quarter eagle. You might get ran over! Images by
Shutterstock and
Stack's Bowers Galleries.
As the opening paragraph stated, the Collectors Rare Coin Index charts the averaged percent performances of 100 coins chosen to represent the "cream of the crop" slice of the United States coin market.
Only U.S. Mint types issued for circulation were considered for inclusion in the Index. By charting percentage movements, all coins are weighted equally (had we charted estimated dollar values, the more expensive coins would have had greater potential to sway the Index).
The CRCI was designed as an informational tool to benefit collectors who pursue United States coins perceived to be rare and historically favored. These connoisseurs occupy a significant swath of the numismatist population (where many of us dwell) and who desire to understand the retailing vigor, past and present, for the small universe of coins we crave most to own.

The
Collector Rare Coin Index tracks the performance of 100 U.S. coins traditionally admired as rarities and craved by collectors for generations. Warning: don’t stand in the path between a motivated numismatist and an 1848 CAL. quarter eagle. You might get ran over! Images by
Shutterstock and
Stack's Bowers Galleries.
The Index begins in January 1990 with a baseline of 100.00. You can see years when U.S. rare coin sales are strong, characterized by sharp upward chart trends. Conversely, periods of weak market activity are readily identifiable.
In 2026, the U.S. rare coin market is at or near record high levels.
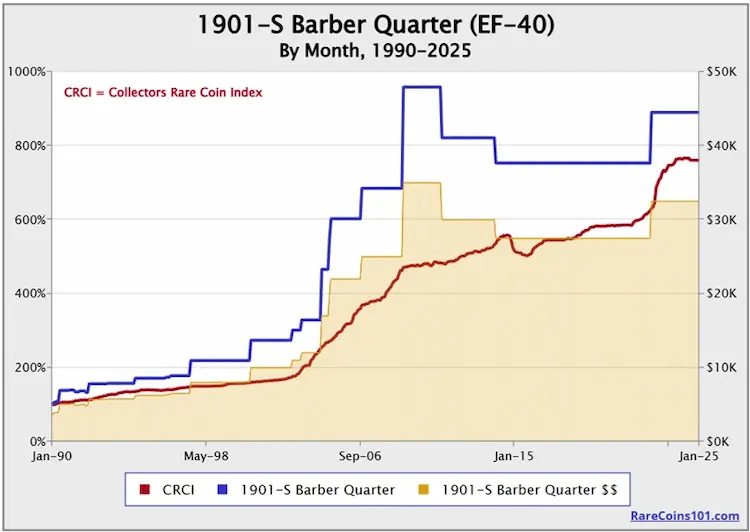
It’s easy to determine which coins have outpaced the CRCI average. As you flip through the charts for individual Index coins, observe how the blue lines relate to the red line. The blue represents the percent change from the Jan 1990 baseline of 100.00 for that specific coin. The red line is the CRCI averaged percent change of all 100 coins.
For a coin with a blue line above the red line, that indicates that coin outperformed the CRCI average. A coin with a blue line south of the red, well… you can guess what that means.
Here's a sample chart to illustrate these points...

In this screenshot of a sample chart, the percentage gains of the 1901-S Barber quarter, depicted by the blue line, have consistently outpaced the Collectors Rare Coin Index, whose movements are reflected by the red line. The gold color conveys the estimated retail value of the 1901-S quarter over the same period of time. All 100 charts of the individual Index coins are structured similarly.

In this screenshot of a sample chart, the percentage gains of the 1901-S Barber quarter, depicted by the blue line, have consistently outpaced the Collectors Rare Coin Index, whose movements are reflected by the red line. The gold color conveys the estimated retail value of the 1901-S quarter over the same period of time. All 100 charts of the individual Index coins are structured similarly.
Certain coins have soared sensationally, while others have essentially trod water or underperformed the CRCI average.
Keep in mind the 100 CRCI coins are relatively rare and have enjoyed popularity with the collector base for generations. Just about any Index coin here that “underperformed” compared to the CRCI still did much better the typical collectible coin.

Although every date in the
Collector Rare Coin Index has been popularly sought by collectors since time immemorial, that doesn’t mean all of them are consistently moving higher in unison. Quite the contrary. Due to the cyclical nature of the hobby, some coins move higher at the same time others are stagnant or moving lower. Their cumulative percentage performance is what the Index indicates, in an effort to measure the overall direction and strength of the U.S. rare coin market. Image by
Shutterstock.
The Dow Jones behaves much the same way. It's normal to witness some of the Dow tracked companies aggressively move higher in stock value, while others are gasping for air. A year later those same companies could have their roles reversed.
What the Collectors Rare Coin Index Does NOT Do
No Ultra-Rarities Tracked
There are no famous ultra-rarities tracked in the Index, so you won’t see the 1894-S Barber dime or 1804 Draped Bust silver dollar, but you will see the 1877 Indian Head cent and the 1848 CAL. Coronet quarter eagle.
To be sure, there are some really tough dates tracked, while others are still within reach of the rank-and-file collector.
Does not Gauge Activity of Entire U.S. Coin Market
The CRCI does not attempt to gauge the activity of the entire U.S. coin market. Bullion-centric and common date collectible coins, as well as modern U.S. Mint merchandise are also important components of the market but occupy inherently distinct dimensions from that characterized by the coins tracked in the Index.
For example, a 1794 Flowing Hair silver dollar has very little in common with a 2017 $1 American Silver Eagle, but both are part of the U.S. coin market. To lump them together in the same Index would be like accepting as data points the running speed of both the three-toed sloth and cheetah in calculating the average mammalian swiftness. Does not make sense!

Yes, this a coin site, but these animals illustrate a point: Does it make sense to calculate the average mammalian speed using the slowest and fastest mammals on earth (three-toed sloth, 0.15 mph and cheetah, 70 mph)?
(1) The average of the two, 35.1 mph, is a useless statistic. By the same token, lumping modern Mint products with rarities traditionally popular with collectors to gauge coin market activity is similarly hollow. Better to create separate indexes for disparate areas of collecting. That’s why the Collector Rare Coin Index tracks only coins sought by collectors for many decades. Images by Wikipedia,
Sloth and
Cheetah.
Does Not Track Cumulative $ Value of the 100 Index Coins
The CRCI does not reflect the movement of the cumulative retail value for the 100 coins tracked. Remember, the Index is charting activity based on the averaged monthly percentage changes of the 100 coins, not their retail prices.
Understanding how this group of special coins fluctuates monthly in value is a worthwhile endeavor. For that reason, Rare Coins 101 does chart the group’s aggregate dollar value. It is reported monthly on a separate chart.
Not surprisingly, the shape of the cumulative value chart line closely resembles that of the CRCI.
Index Calculation Details
Step-by-Step Calculations
Here is the step-by-step process to calculate the Collectors Rare Coin Index:
- Once a month, for each coin in the Index, the current retail value is estimated and entered into a spreadsheet.
- For each coin, the current retail value is divided by the coin’s value for the baseline month of January 1990.
- That result (called the quotient in math speak) is then multiplied by 100 to arrive at the updated Index percentage score for that coin. (Most of the time there is no change in dollar value from one month to the next, so the updated Index percentage score is more often than not the same as the previous month.)
- The average for all 100 updated percentage scores is calculated, and this becomes the newest entry in the CRCI chart.
Simple as that!
Let’s look at an example at how the monthly percentage score is calculated for an individual Index coin:
Example: Update CRCI Percent Score for an Individual Index Coin
- Consider the 1891 $20 double eagle in EF-40 grade. In January 2026, this coin had an estimated retail of $44,000. This same coin had an estimated retail value in the baseline month of January 1990 of $3,750.
- 44,000 divided by 3,750 is 11.733.
- 11.733 multiplied by 100 is 1173.33. This is the updated Index percentage score for the 1891 $20 double eagle (also indicating the coin is worth 1173.33% of its starting value)
- This number and the updated percentage scores of the other 99 coins tracked in the Index are averaged to compute the overall index score for the month. In January 2026, this number was 782.47%, and this was the number added to the CRCI chart.
Where Does the Coin Value Data Come From?
The coin values fed into the Collectors Rare Coin Index computations were obtained from a variety of widely respected coin price guides, most of them produced by Amos Media (they're the Coin World folks). They’ve been publishing high quality numismatic literature since 1960.
